49  People care about resource distribution

Summary

  • Distributional preferences relate to how people value the relative distribution of resources among people.
  • Distributional preferences can be incorporated into economic analysis by including others’ outcomes in utility functions.
  • Altruism is a type of distributional preference where an individual places a positive weight on others’ outcomes. It can be pure (genuine concern for others) or impure (deriving satisfaction from doing good).
  • Inequality aversion is a type of distributional preference where people dislike having less than others and may also dislike having more than others.
  • We can also model other distributional preferences, including status-seeking, Rawlsian and utilitarian preferences.

49.1 Introduction

In 2008, when the Sacramento Bee created a database of California state worker salaries, University of California (UC) employees could learn about their colleagues’ pay for the first time. Researchers at three UC campuses studied the impact by randomly emailing some employees about the database (Card et al., 2012).

Employees who learned they earned below the median for their department and role reported lower job satisfaction and began searching for new positions. The effect was strongest among workers in the bottom quartile of their unit’s pay scale. A follow-up two to three years later suggested more lower-paid employees had left their positions.

In contrast, employees above the median showed no changes in satisfaction or behaviour after learning about peer salaries.

This research shows that people care about their position relative to others, not just their absolute circumstances. The dissatisfaction and subsequent job-seeking of low-paid UC employees revealed ‘distributional preferences’, preferences about the allocation of resources across individuals.

To understand how social comparisons influence economic decisions, we can model these distributional preferences mathematically. Economists model distributional preferences by extending utility functions to include others’ outcomes, just as we model preferences over personal consumption.

This approach allows us to analyse how social considerations influence economic decision-making in contexts ranging from charitable giving to workplace compensation. Understanding distributional preferences can help us explain behaviour that deviates from pure self-interest in experimental games. We can use them to examine how inequality and social comparisons affect economic decisions. This can inform the design of workplace arrangements and economic policies that account for social preferences

In what follows, I examine two forms of distributional preferences in detail - altruism and inequality aversion - and consider other social preferences. Each helps explain different aspects of observed behaviour, from charitable giving motivated by altruism to rejection of unfair offers driven by inequality aversion.

49.2 Altruism

Altruism is concern for the outcomes of others, with positive weights on others’ wellbeing.

To incorporate altruism, we give a positive weight to the utility of others in the utility function. Here’s a simple example where an individual’s utility depends on both their own outcome and another person’s:

U_i(x_i,x_j)=x_i+\alpha x_j

The utility of agent i, U_i, is a function of the the outcome for agent i, x_i, and agent j, x_j. \alpha is some number greater than zero, with utility increasing linearly with an increased payoff for either agent.

Altruism comes in two forms. Pure altruism reflects genuine concern for others’ wellbeing. Impure altruism occurs when people get a ‘warm glow’ from doing good, regardless of the actual impact on others.

49.2.1 Example: the public goods game

Consider a public goods game where two players each have $10 and must simultaneously decide how much to contribute to a public project. The total contributions are multiplied by 1.5 and split equally between both players, regardless of their individual contributions.

This game captures real-world situations: work teams deciding effort on shared projects, neighbors contributing to community improvements, or countries investing in climate change mitigation.

For this scenario, if both players contribute their full $10, the pot becomes $30 and each receives $15.

If neither contributes, each keeps their $10. If one contributes $10 and the other $0, the $15 pot is split equally so the contributor gets $7.50 and the non-contributor gets $17.50.

A self-interested player would contribute nothing. For any contribution by the other player, keeping your money always gives a higher payoff. However, both players would be better off if they both contributed everything.

Now suppose both players have altruistic preferences, placing a positive weight on the other’s outcome (albeit lower than the weight on their own outcome):

U_i(x_i,x_j)=x_i+0.75x_j

With these preferences, we can calculate whether contributing is optimal if the other person contributes. If the agent contributes, they receive utility from their $15 and the $15 received by the other agent.

\begin{align*} U_i(\text{contribute})&=15+0.75\times 15\\[6pt] &=26.25 \end{align*}

If they do not contribute, they receive utility from their higher payoff of $17.50, but the lower payoff of $7.50 for the other agent acts as a drag.

\begin{align*} U_i(\text{free ride})&=17.50+0.75\times 7.50\\[6pt] &=23.125 \end{align*}

With these altruistic preferences, contributing is optimal when the other player contributes. The weight placed on the other player’s payoff (\alpha=0.75) makes cooperation the best response to cooperation.

Contributing is actually the best response to any contribution by the other player. For example, here are the payoffs in response to a contribution of $0 by the other player. If the agent contributes, they receive utility from their $7.50 and the other player’s $17.50.

\begin{align*} U_i(\text{contribute})&=7.5+0.75\times 17.5 \\[6pt] &=20.625 \end{align*}

If they do not contribute, they receive utility from their higher payoff of $10, but the lower payoff of $10 for the other player reduces their utility more than they gain for the increased personal payoff.

\begin{align*} U_i(\text{free ride})&=10+0.75\times 10 \\[6pt] &=17.50 \end{align*}

An altruistic player would contribute even if the other player is not an altruist.

This example shows how moderate altruism can overcome the free-rider problem in public goods provision. The positive weight two altruistic players place on the other’s outcome makes mutual contribution a Nash equilibrium.

49.2.2 Limitations of the altruism model

While altruism helps explain behaviours like charitable giving, it has limitations.

Recall the ultimatum game. The first player (the proposer) receives a sum of money (say $10) and must offer some portion of it to the second player (the responder). The responder then has two options:

  • Accept the offer: both players get the proposed split

  • Reject the offer: both players get nothing

Altruism can explain why proposers make generous offers, but it fails to explain why responders often reject low offers, knowingly reducing both players’ payoffs. Such rejection would require negative weights on outcomes, contradicting the altruism model.

49.3 Inequality aversion

Inequality aversion offers an explanation for such rejections. We dislike being worse off than others, and to a lesser extent, we may feel uncomfortable being better off than others. This captures the intuition that people care about relative standing. Think of how employees react to learning their co-workers earn more, or the guilt some feel about their wealth relative to those in poverty.

49.3.1 A model of inequality aversion

To understand how inequality aversion affects decision-making, we need a formal way to represent these preferences. Fehr and Schmidt (1999) developed an influential model that captures both the dislike of having less than others and the potential discomfort of having more.

In their model, the utility of agent i, u_i, is a function of the payoff of agent i and the payoff of agent j.

u_i(x_i,x_j)=x_i-\alpha\text{max}\{x_j-x_i,0\}-\beta\text{max}\{x_i-x_j,0\} \\[12pt] \alpha>0 \quad \textrm{and} \quad \beta>0

Each term in this equation represents a distinct psychological effect:

  • x_i is their own outcome, such as their payoff or salary

  • \alpha\text{max}\{x_j-x_i,0\} captures the sting of disadvantageous inequality, like discovering your colleague earns more than you

  • \beta\text{max}\{x_i-x_j,0\} represents the discomfort of advantageous inequality, like feeling guilty about your high salary compared to others or the guilt of making a low offer in the ultimatum game.

The \text{max} function ensures that only the relevant term is included. If agent i has more than the other player, with x_i higher than x_j, the disadvantageous inequality term is zero. If agent i has less, the advantageous inequality term is zero.

To present the utility function in a form you may find more intuitive without the \text{max} function, we can rewrite it with utility of agent i being their own payoff, minus a penalty for either advantageous or disadvantageous inequality.

u_i(x_i,x_j)=x_i-\left\{\begin{matrix} \beta(x_i-x_j) \quad &\textrm{if} \quad x_i \geq x_j \\[6pt] \alpha(x_j-x_i) \quad &\textrm{if} \quad x_i < x_j \end{matrix}\right.

Typically \alpha>\beta as people dislike having less than others more than they dislike having more than others. We could also set \beta<0 for an agent that likes to be better off than others.

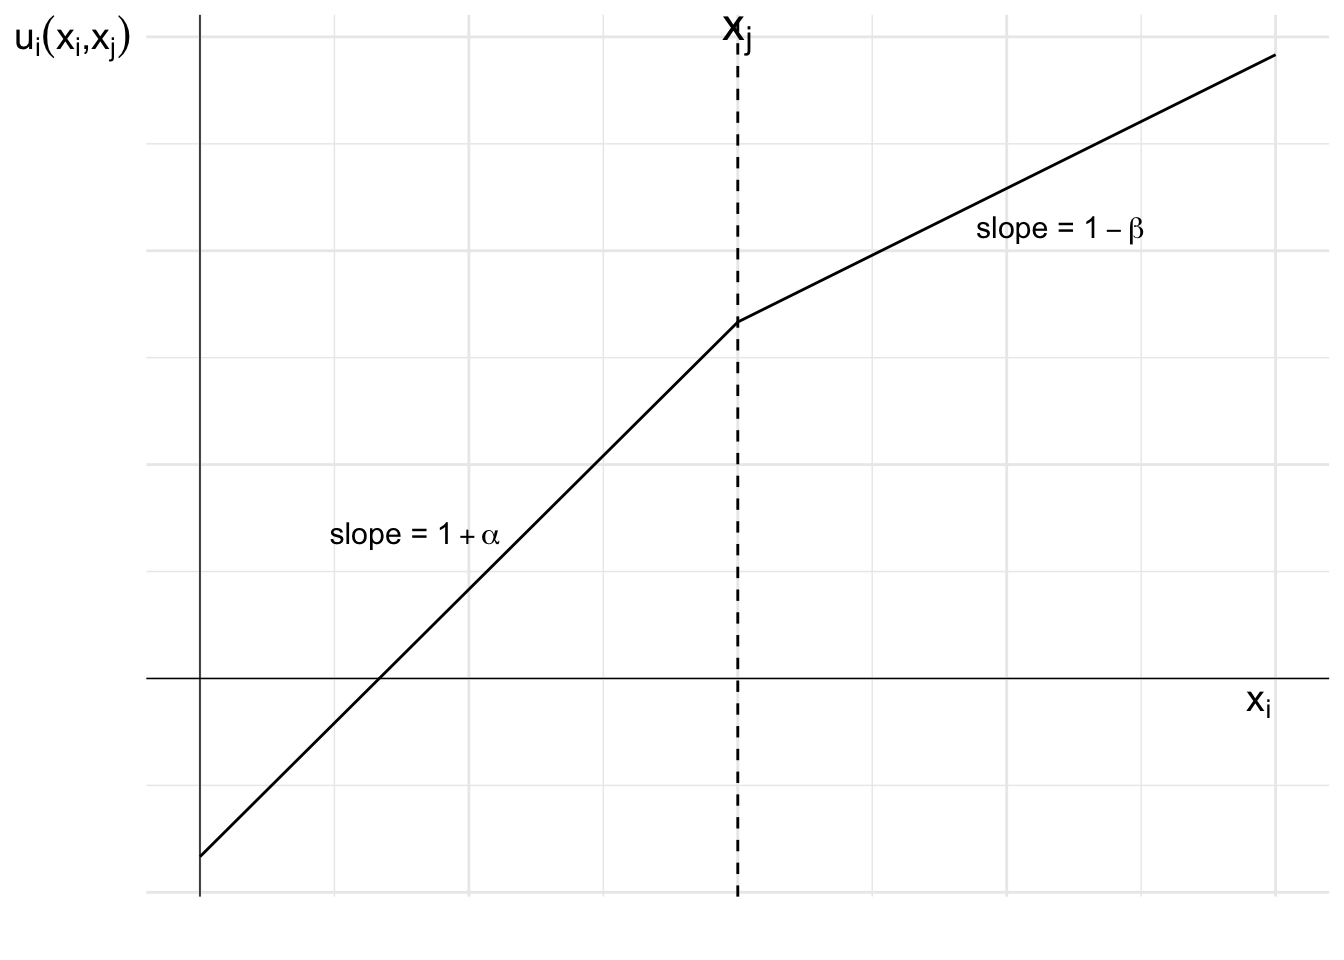
To visualise how inequality aversion affects utility, the following graph shows a plot of utility as a function of x_i.

This utility function has a kink at x_j where agent i moves from having less to more than agent j. Below x_j, utility increases due to both the increasing material outcome for agent i, plus the reduction in inequality. If \beta is between 0 and 1 as in this diagram, the utility of agent i, U(x_i), continues to increase in x_i above x_j, but at a decreasing rate, as inequality degrades the benefits of having more.

Code
library(ggplot2)

# Define parameter values
x_i <- seq(0, 10, by=0.1)  # Range of x_i values
x_j <- 5                    # Fixed reference point
alpha <- 0.5                # Disadvantageous inequality parameter
beta <- 0.25                # Advantageous inequality parameter

# Define utility function
# Returns utility value given own payoff (x_i), reference payoff (x_j), and inequality parameters
u_i <- function(x_i, x_j, alpha, beta) {
 ifelse(x_i >= x_j, 
        x_i - beta*(x_i - x_j),    # Case where x_i is higher
        x_i - alpha*(x_j - x_i))    # Case where x_i is lower
}

# Create dataframe for plotting
df <- data.frame(x_i=x_i, u_i=u_i(x_i, x_j, alpha, beta))

# Generate plot
ggplot(df, aes(x=x_i, y=u_i)) +
    geom_line() +
    geom_vline(xintercept = 0, linewidth=0.25)+ 
    geom_hline(yintercept = 0, linewidth=0.25)+
    geom_vline(xintercept=x_j, linetype="dashed") +  # Reference point line
    
    # Add x_j label to vertical line
    annotate("text", x=x_j, y=max(df$u_i), label=expression(x[j]), vjust=-0, size=6) +
    # Add slope labels at appropriate positions
    annotate("text", x=2, y=2, label=expression(paste("slope = ", 1 + alpha)), size=4) +
    annotate("text", x=8, y=6.3, label=expression(paste("slope = ", 1 - beta)), size=4) +

    labs(
      x=expression(x[i]),
      y = expression(u[i](x[i]*","*x[j]))
      ) +

 theme_minimal() +
 theme(
    axis.title.y=element_text(angle=0, hjust=0.5, size=14),
    axis.title.x = element_text(hjust=0.95, vjust=29, size=14),
    axis.text.x = element_blank(),    # Remove x-axis numbers
    axis.text.y = element_blank()
       )    # Remove y-axis numbers
Figure 49.1: An inequality aversion utility function

49.3.2 Example: the ultimatum game

This theoretical model of inequality aversion helps explain real-world behaviors that cannot explained by pure self-interest. This includes behaviour in the ultimatum game, a classic example where people often act against their material self-interest.

A purely self-interested responder should accept any non-zero offer, as something is better than nothing. Yet people often reject unfair offers, such as job candidates rejecting a low salary even though this leaves both parties worse off. The pain of inequality outweighs the cash.

Suppose the responder in the ultimatum game has inequality averse preferences with \beta=0.25 and \alpha=0.5. u_i(x_i,x_j)=x_i-0.5\text{max}\{x_j-x_i,0\}-0.25\text{max}\{x_i-x_j,0\}

What offers x would the responder reject where the proposer has $10 to split between them?

If the responder rejects, the payoff to the proposer and responder is zero. That is:

x_P=x_R=0

If the responder accepts, the responder receives x, and the proposer keeps the remainder. That is:

\begin{align*} x_P&=10−x \\[6pt] x_R&=x \end{align*}

The responder will accept if the utility of accepting is greater than the utility of rejecting.

U_R(\text{accept})>U_R(\text{reject})

I will examine offers above and then below $5. First, I will look at offers above.

We substitute the utility function into the inequality. As the \alpha term equals zero, I do not include it here. We then enter the ultimatum game outcomes for acceptance and simplify.

\begin{align*} U_R(\text{accept})&>U_R(\text{reject}) \\[6pt] x_R−\beta(x_R−x_P)&>0 \\[6pt] x-0.25(x-(10-x))&>0 \\[6pt] x−0.25(2x−10)&>0 \end{align*}

This inequality will hold for any \beta<1 as x \geq 2x-10 for any x \leq 10. Therefore, the condition will hold for the agent with \beta=0.25. Recall that if \beta<1 the responder has higher utility from a higher payoff but at a decreasing rate when they have more than the proposer.

When the offer is below $5, the responder gets less than the proposer, so only \alpha matters. Again, I substitute the utility function into the inequality, enter the ultimatum game outcomes and simplify.

\begin{align*} U_R(\text{accept})&>U_R(\text{reject}) \\[6pt] x_R−\alpha(x_P−x_R)&>0 \\[6pt] x−0.5(10−x-x)&>0 \\[6pt] x&>2.50 \end{align*}

The responder with \alpha=1/2 will reject offers below $2.50.

We can plot the utility of the responder as a function of the offer x. As the offer is not independent of the proposer’s payoff, I will derive the shape of the utility curve as a function of x_R=x. I do this by substituting the payoffs and values of alpha into the utility function.

\begin{align*} U_R(x_P,x_R)&=x_R-\alpha\text{max}\{x_P-x_R,0\}-\beta\text{max}\{x_R-x_P,0\} \\[6pt] &=x-0.5\text{max}\{10-2x,0\}-0.25\text{max}\{2x-10,0\} \end{align*}

We can also write this equation to explicitly show the slope of the curve. I first manipulate the equation into a form showing the slope times (x) plus intercept. I then simplify.

\begin{align*} U_R(x)&=\left\{\begin{matrix} (1+2\alpha)x−10\alpha \quad &\textrm{if} \quad x < 5 \\[6pt] (1−2\beta)x+10\beta \quad &\textrm{if} \quad x \geq 5 \end{matrix}\right. \\[12pt] &=\left\{\begin{matrix} 2x−5 \qquad &\textrm{if} \quad x < 5 \\[6pt] 0.5x+2.5 \qquad &\textrm{if} \quad x \geq 5 \end{matrix}\right. \end{align*}

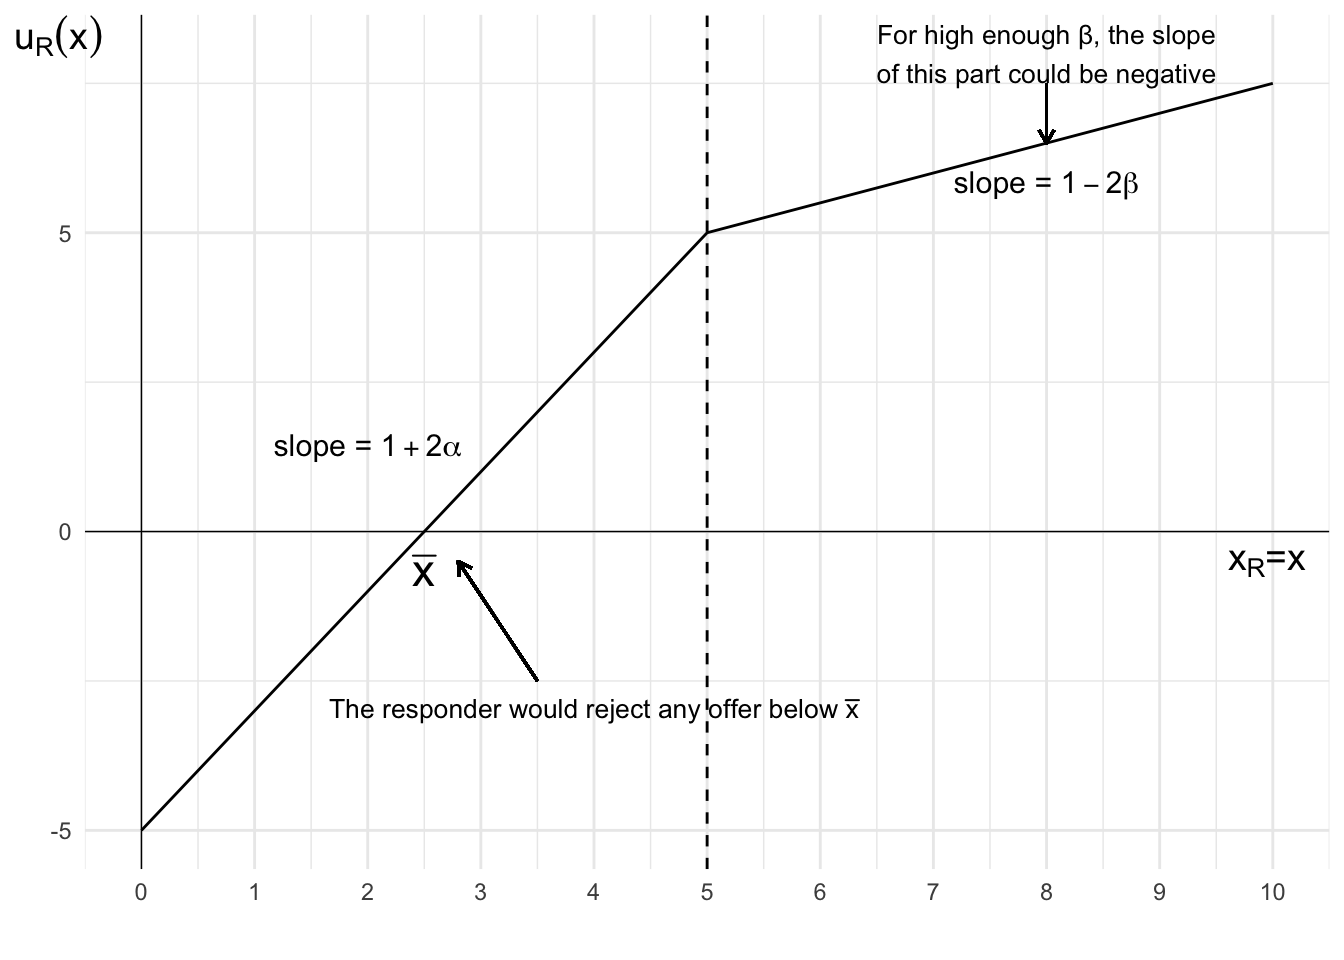
This diagram shows the responder’s utility curve as a function of the offer x. The slope of the curve for x<5 is 1+2\alpha=2 and for x\geq5 is 1-2\beta=0.5. These slopes differ from our earlier inequality aversion utility plot because, here, any gain for the responder means an equal loss for the proposer.

This relationship creates a double effect on inequality. Consider an offer increase from $4 to $5: the responder’s payoff rises by $1, but the gap between players shrinks by $2. This explains why the slope is steeper when behind.

The opposite happens when the responder is ahead. If the offer increases from $6 to $7, the responder gains $1 but inequality grows by $2. This larger penalty for inequality acts as a drag on utility, making the slope flatter.

Code
library(ggplot2)

# Define parameter values
x_R <- seq(0, 10, by=0.1)  # Range of x_R values
x_5 <- 5                    # Point where x_R = x_P
alpha <- 0.5                # Disadvantageous inequality parameter
beta <- 0.25                # Advantageous inequality parameter

# Define utility function
# Returns utility value given own payoff (x_R), proposer payoff (x_P), and inequality parameters
u_i <- function(x_R, x_P, alpha, beta) {
 ifelse(x_R >= x_P, 
        (1 - 2*beta)*x_R + 10*beta,    # Case where x_R is higher
        (1 + 2*alpha)*x_R - 10*alpha
        )    # Case where x_R is lower
}

# Create dataframe for plotting
df <- data.frame(x_i=x_i, u_i=u_i(x_i, x_j, alpha, beta))

# Generate plot
ggplot(df, aes(x=x_i, y=u_i)) +
    geom_line() +
    geom_vline(xintercept = 0, linewidth=0.25)+ 
    geom_hline(yintercept = 0, linewidth=0.25)+
    geom_vline(xintercept=x_j, linetype="dashed") +  # Reference point line
    scale_x_continuous(breaks = seq(0, 10, by = 1)) +
    
    # Add slope labels at appropriate positions
    annotate("text", x=2, y=1.4, label=expression(paste("slope = ", 1 + 2*alpha)), size=4) +
    annotate("text", x=8, y=5.8, label=expression(paste("slope = ", 1 - 2*beta)), size=4) +

    # Add arrow and text for high beta note
    annotate("text", x=8, y=8, label="For high enough β, the slope\nof this part could be negative", size=3.5) +
    geom_segment(aes(x=8, y=7.5, xend=8, yend=6.5), arrow=arrow(length=unit(0.2, "cm"))) +

    annotate("text", x=4, y=-3, label=expression(paste("The responder would reject any offer below ", bar(x))), size=3.5) +
    geom_segment(aes(x=3.5, y=-2.5, xend=2.8, yend=-0.5), arrow=arrow(length=unit(0.2, "cm"))) +

    annotate("text", x=2.5, y=0, label=expression(bar(x)), size=6, vjust=1.8) +

    labs(
      x=expression(x[R]*"="*x),
      y = expression(u[R](x))
      ) +

 theme_minimal() +
 theme(
    axis.title.y=element_text(angle=0, margin=margin(r=-20), vjust=1, size=14),
    axis.title.x = element_text(hjust=0.98, vjust=47, size=14)
       )
Figure 49.2: Utility curve for the responder in the ultimatum game with inequality aversion

The curve has a kink at x=5 where the responder moves from having less to more than the proposer. The point where the curve crosses the x-axis represents the point below which the responder would reject the offer.

49.3.3 Example: the dictator game

While the ultimatum game shows how inequality aversion affects responses to unfair offers, the dictator game helps us understand how inequality aversion might influence giving behaviour.

In the dictator game, the dictator makes a unilateral offer to the receiver. The game then ends. The receiver has an empty strategy set.

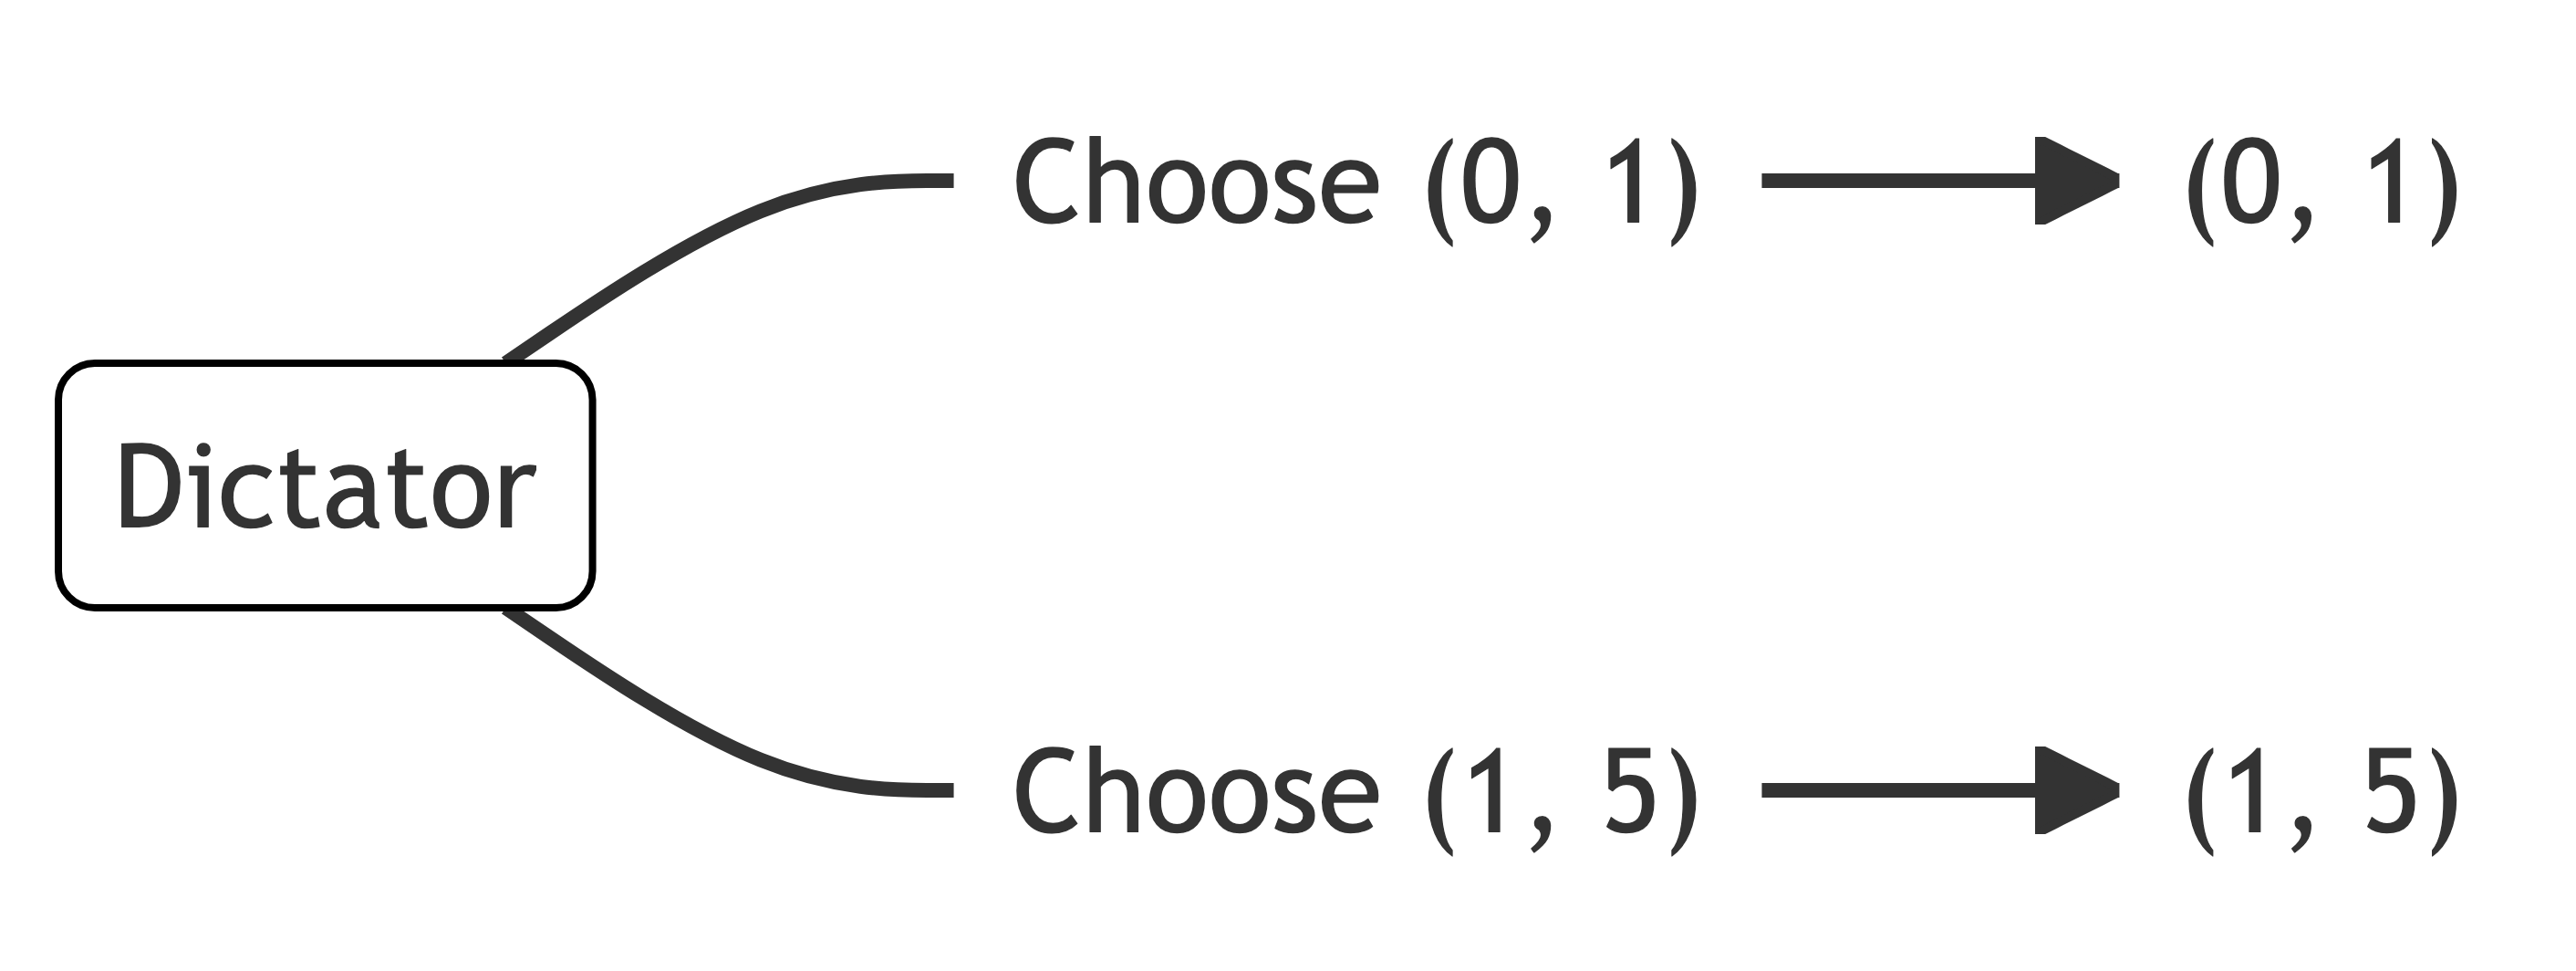
In this version of the game, the dictator has a constrained choice set and must decide between the allocations (0, 1) and (1, 5), where (x_D,x_R) represent the payoffs for the dictator and receiver, respectively. The dictator’s \alpha=1/2. As the dictator has less than the other player under each distribution, \alpha is the relevant parameter.

We can calculate the dictator’s utility of each allocation. The (0,1) allocation gives a utility of zero for the dictator’s payoff minus alpha times the inequality.

\begin{align*} U(0,1)&=0-\alpha\times (1-0) \\[6pt] &=-1/2 \times 1 \\[6pt] &=−1/2 \end{align*}

The (1,5) allocation gives a utility of one for the dictator’s payoff minus alpha times the larger inequality.

\begin{align*} U(1,5)&=1-\alpha\times (5-1) \\[6pt] &=1-1/2 \times 4 \\[6pt] &=−1 \end{align*}

The dictator prefers to allocate (0,1) as the cost of the inequality is greater than the benefit from the increased payoff.

\alpha>0 can also account for the rejection of low offers in the ultimatum game.

49.4 Other distributional preferences

While altruism and inequality aversion explain many observed behaviours, they are not the only types of social preference. Rearranging the inequality aversion model reveals the direct weights people place on others’ outcomes. Where x_i>x_j, agent i places weight of \beta on the other’s outcome and 1-\beta on their own. Where x_i<x_j, agent i places weight of -\alpha on the other’s outcome and 1+\alpha on their own.

u_i(x_i,x_j)=\left\{\begin{matrix} \beta x_j+(1-\beta)x_i \quad &\textrm{if} \quad x_i \geq x_j \\[6pt] -\alpha x_j+(1+\alpha)x_i \quad &\textrm{if} \quad x_i < x_j \end{matrix}\right.

Arranging in this way makes the weight given to the outcomes for each agent more transparent. It provides a more intuitive way to consider some distributional preferences.

Charness and Rabin (2002) used this form with parameters \sigma and \rho (where \sigma=-\alpha and \rho=\beta). We’ll follow their approach since having parameters with the same sign makes the analysis more intuitive.

u_i(x_i,x_j)=\left\{\begin{matrix} \rho x_j+(1-\rho)x_i \quad &\textrm{if} \quad x_i \geq x_j \\[6pt] \sigma x_j+(1-\sigma)x_i \quad &\textrm{if} \quad x_i < x_j \end{matrix}\right.

49.4.1 Forms of distributional preferences

We can adjust the values of \rho and \sigma to capture many forms of distributional preferences. Some are as follows.

An altruistic agent has \sigma>0 and \rho>0. They weight others’ payoffs positively in all situations. When someone else gains a dollar, it directly increases the agent’s utility, regardless of whether they are ahead or behind. Compared to our earlier altruism model, this model allows for different degrees of altruism depending on the relative payoffs of the two agents.

An inequality-averse agent has 1\geq\rho > 0>\sigma. They like gains for others who are behind but dislike falling further behind themselves. This inequality is equivalent to \alpha>0 and \beta>0 in the Fehr-Schmidt model.

A status-seeking agent has 0>\rho\geq\sigma. Not only do they dislike others gaining, they actively prefer having more than others. Their utility goes up when either they get more or the other player gets less.

A classically self-interested agent has \rho=\sigma=0. Their utility depends only on their own payoff.

A Rawlsian agent has \rho=1 and \sigma=0, making their utility u_i(x_i,x_j)=\text{min}\{x_i,x_j\}. They maximise the minimum payoff across all players, showing pure concern for the worst-off individual.

A utilitarian agent has \rho=\sigma=1/2, making their utility u_i(x_i,x_j)=x_i+x_j. They weight everyone’s payoff equally and simply sum the total, caring about efficiency rather than distribution.

49.4.2 Example: the trust game

Let’s use this form of the utility function to analyse the outcomes in a trust game, where an investor must decide whether to trust an entrepreneur with their money.

The trust game provides a lens for understanding how social preferences affect economic transactions where success requires sequential cooperation and trust. The trust game captures two key real-world dynamics. First, one party must choose whether to make themselves vulnerable to exploitation by trusting the other. Second, the trusted party must then decide whether to honour or betray that trust.

This structure mirrors some common economic situations. Investors must decide whether to trust entrepreneurs with capital before knowing if they will act in good faith. Business partners often need to commit resources before knowing if their counterparts will uphold their end of the deal. Even simple transactions, like paying in advance for services, involve one party trusting another to deliver as promised.

In the exercises in Section 44.3, I considered a scenario between Linda, a potential investor, and Marco, an entrepreneur. This mirrors common situations where investors must decide whether to trust entrepreneurs with capital, and entrepreneurs must choose between short-term gain and maintaining their reputation. Their choices will depend not just on monetary payoffs, but on how each values the other’s outcomes.

Linda is looking for investment opportunities. She identifies a promising crypto-based start-up created by Marco. Marco is looking for seed funding.

Linda can invest $10.

If Linda invests, her investment will triple in value. Marco can then decide to either shut down the start-up and keep the $30 or maintain the start-up in the market and pay a $15 dividend to each of Linda and himself.

If Linda does not invest, Linda keeps the $10. The start-up gets $0.
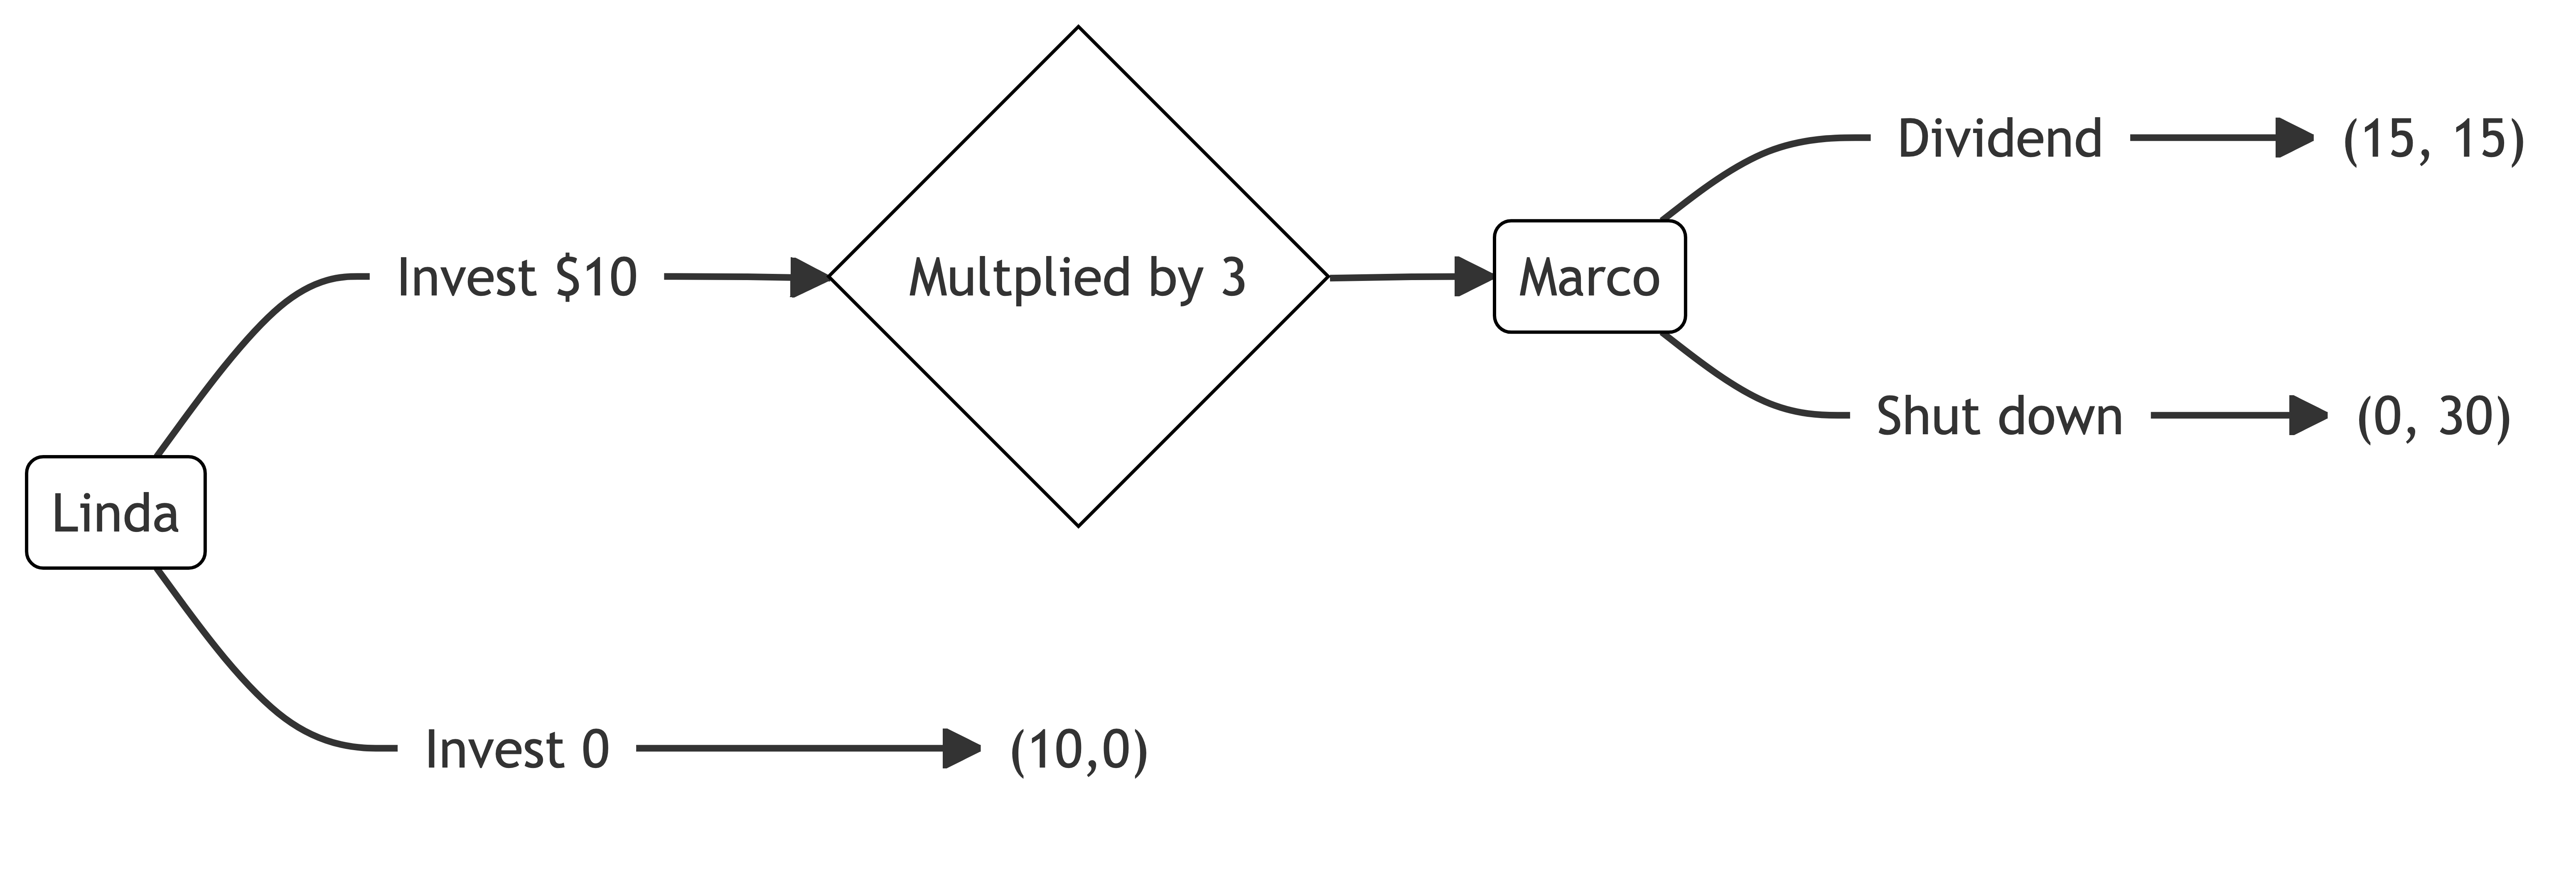
Marco is effectively playing a dictator game. If he were purely self-interested, he would shut down and keep the $30. As a result, a purely self-interested Linda would not invest.

Let’s examine both players’ actions if their utility functions place weight on the outcome of the other. U_L and U_M are Linda and Marco’s utility. x_L and x_M are the outcomes for Linda and Marco.

Linda’s utility function shows moderate concern for Marco’s outcomes: U_L(x_M,x_L)=\left\{\begin{matrix} \frac{2}{3}x_M+\frac{1}{3}x_L \quad &\textrm{if} \quad x_L \geq x_M\\[6pt] \frac{1}{3}x_M+\frac{2}{3}x_L \quad &\textrm{if} \quad x_L < x_M \end{matrix}\right.

When Linda is ahead, she places more weight on Marco’s payoff (\rho=2/3) than her own (1-\rho=1/3), suggesting significant altruism. When behind, she still values Marco’s payoff positively (\sigma=1/3), but prioritises her own outcome (1-\sigma=2/3).

Marco’s preferences are more asymmetric:

U_M(x_L,x_M)=\left\{\begin{matrix} \frac{3}{4}x_L+\frac{1}{4}x_M \quad &\textrm{if} \quad x_M \geq x_L\\[6pt] x_M \quad &\textrm{if} \quad x_M < x_L \end{matrix}\right.

He shows concern for Linda’s outcomes only when he’s ahead, otherwise focusing solely on his own payoff. This asymmetry reflects a mix of self-interest and conditional altruism.

If Marco and Linda know each other’s utility functions, what is the equilibrium with these distributional preferences?

If Linda chooses trust, Marco has a choice between $15 each and $30 for himself. Marco calculates the utility of each option.

\begin{align*} U_M(15,15)&=\frac{3}{4}(15)+\frac{1}{4}(15)\\[12pt] &=15 \\[12pt] U_M(0,30)&=\frac{3}{4}(0)+\frac{1}{4}(30) \\[12pt] &=7.5 \end{align*}

Marco receives higher utility by paying the dividend to Linda.

We can also calculate Linda’s utility for each of Marco’s options if she chooses to trust.

\begin{align*} U_L(15,15)&=\frac{2}{3}(15)+\frac{1}{3}(15) \\[12pt] &=15 \\[12pt] U_L(0,30)&=\frac{1}{3}(30)+\frac{2}{3}(30) \\[12pt] &=10 \end{align*}

Linda’s utility is higher if Marco pays a dividend.

For the other node, if Linda does not invest, she will keep $10. Marco will have nothing. Each has the following utility from that failure to invest.

\begin{align*} U_M(10,0)&=0 \\ \\ U_L(0,10)&=\frac{2}{3}(0)+\frac{1}{3}(10) \\[12pt] &=3.33 \end{align*}

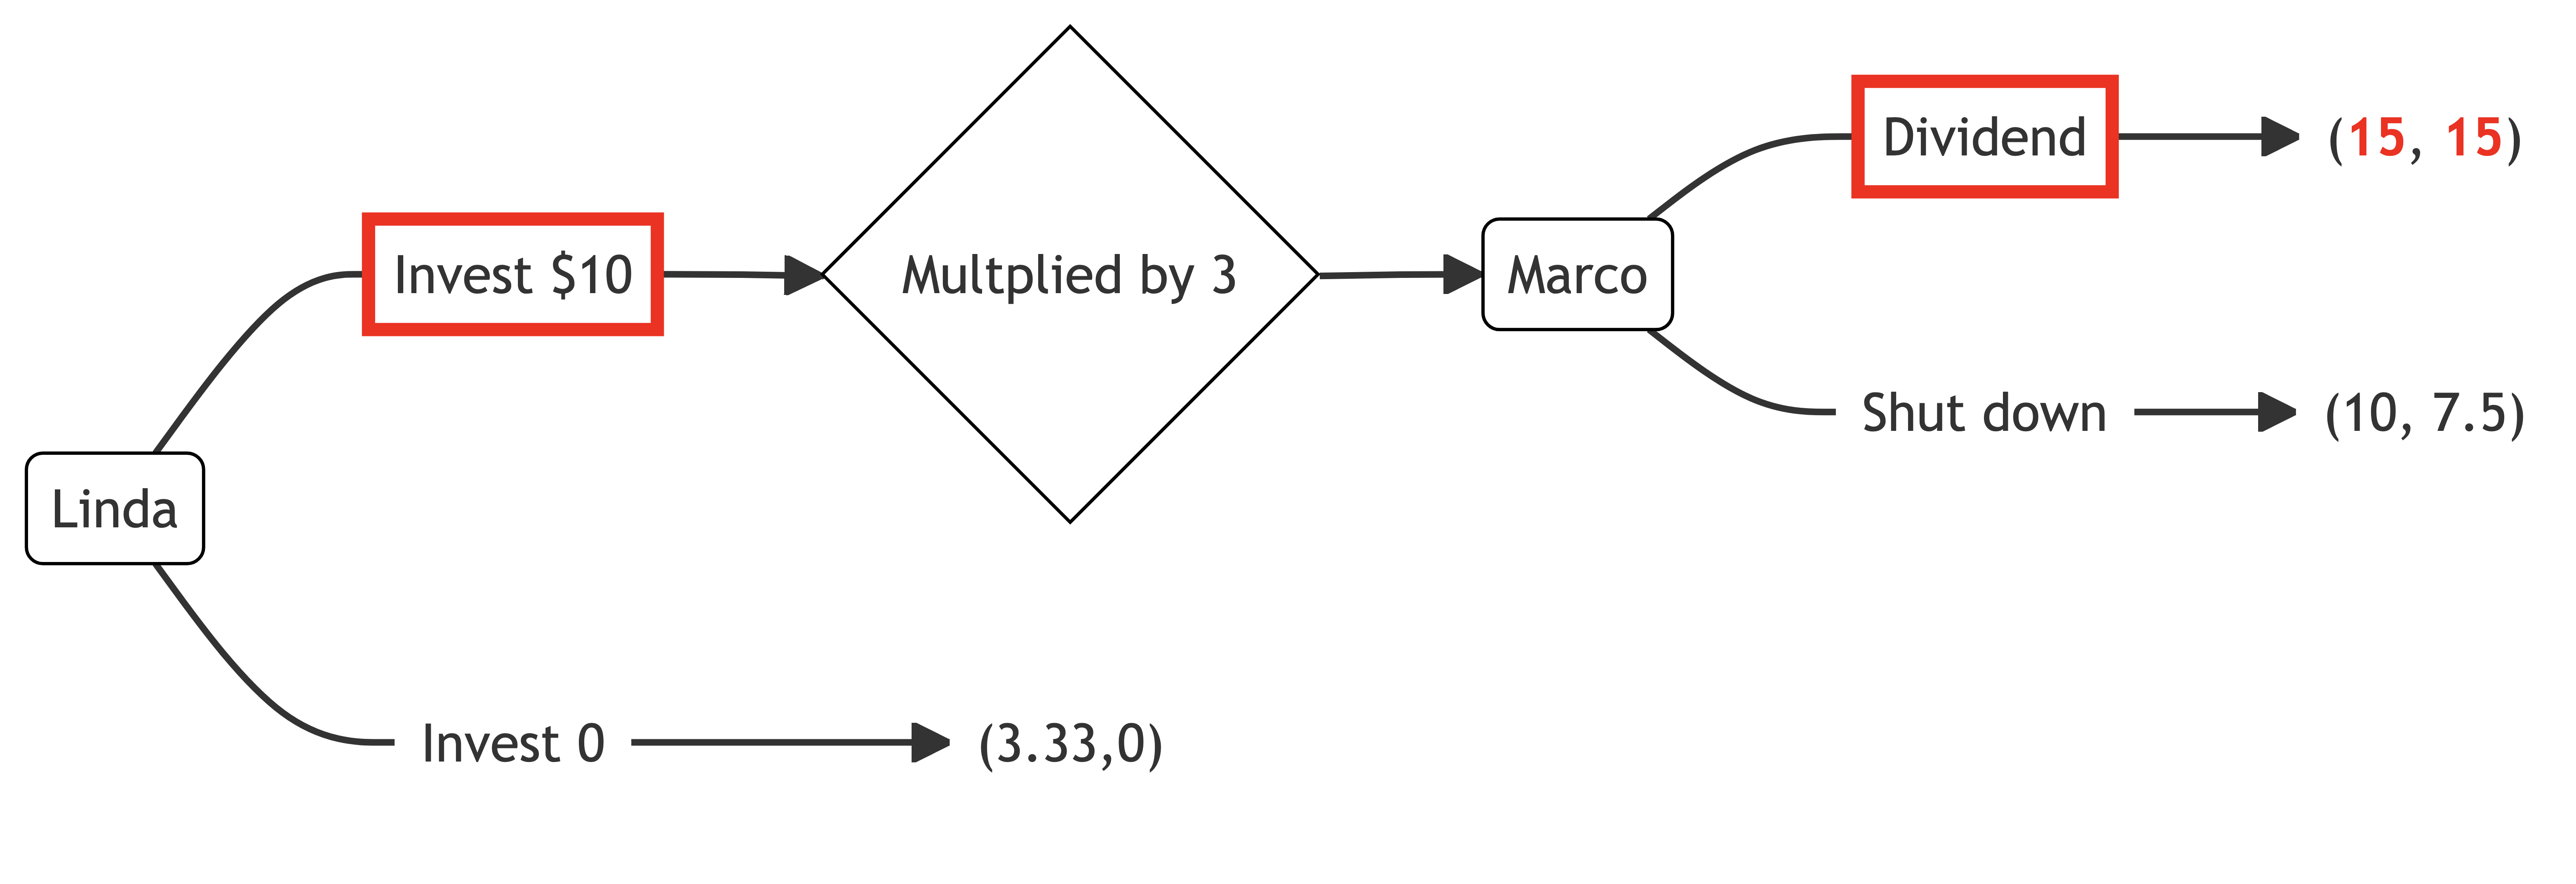
Putting those payoffs into the extensive form of the game, we get the following, with payoffs of (15,15) if Linda invests and Marco returns the dividend, (10,7.5) if Linda invests and Marco does not return the dividend, and (3.33,0) if Linda does not invest.
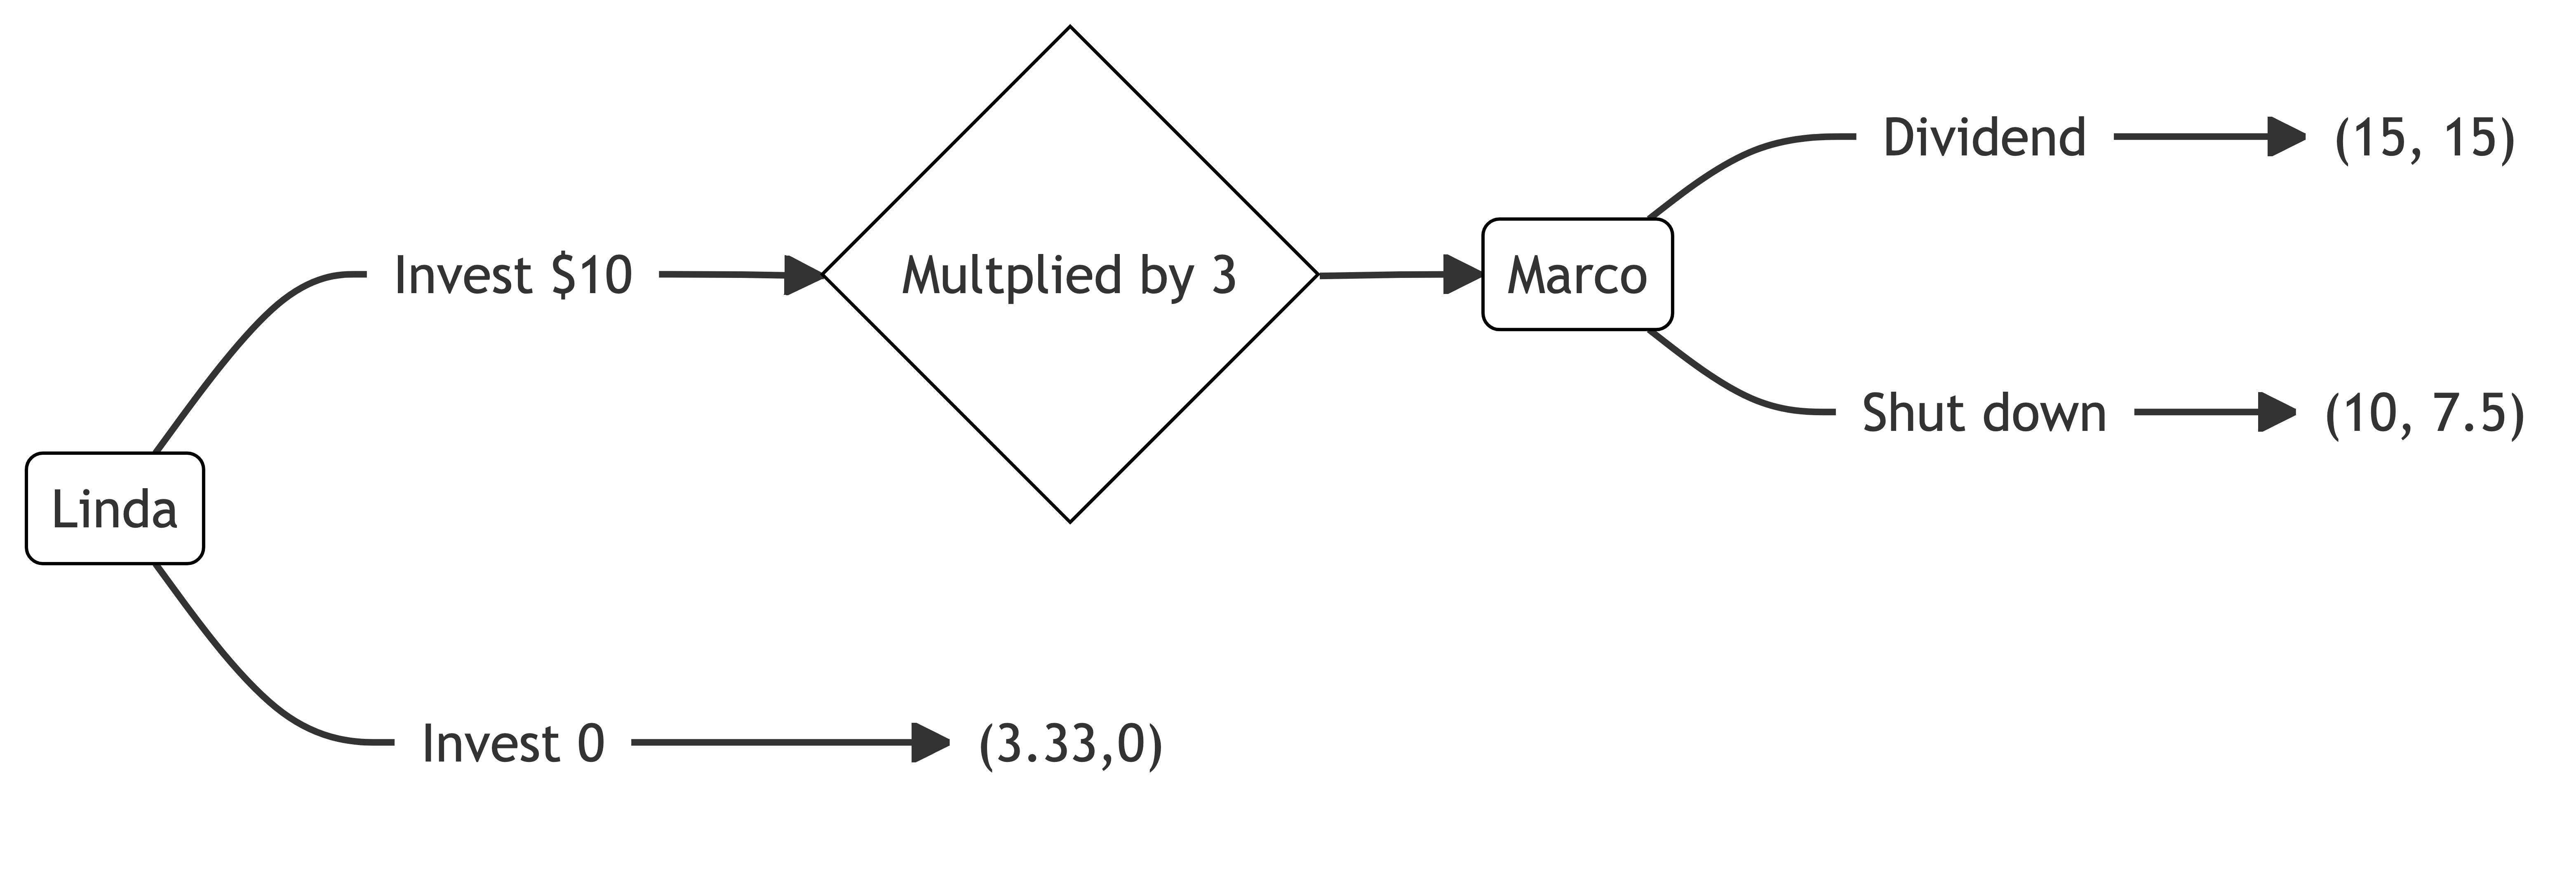
To solve for the game’s equilibrium, we use backward induction, starting with Marco’s decision if Linda invests.

Marco can return a dividend for utility 15 or shut down for utility 7.5. He chooses to return the dividend. As a result, Linda will invest for utility 15, rather than not invest for utility 3.33. Linda invests.